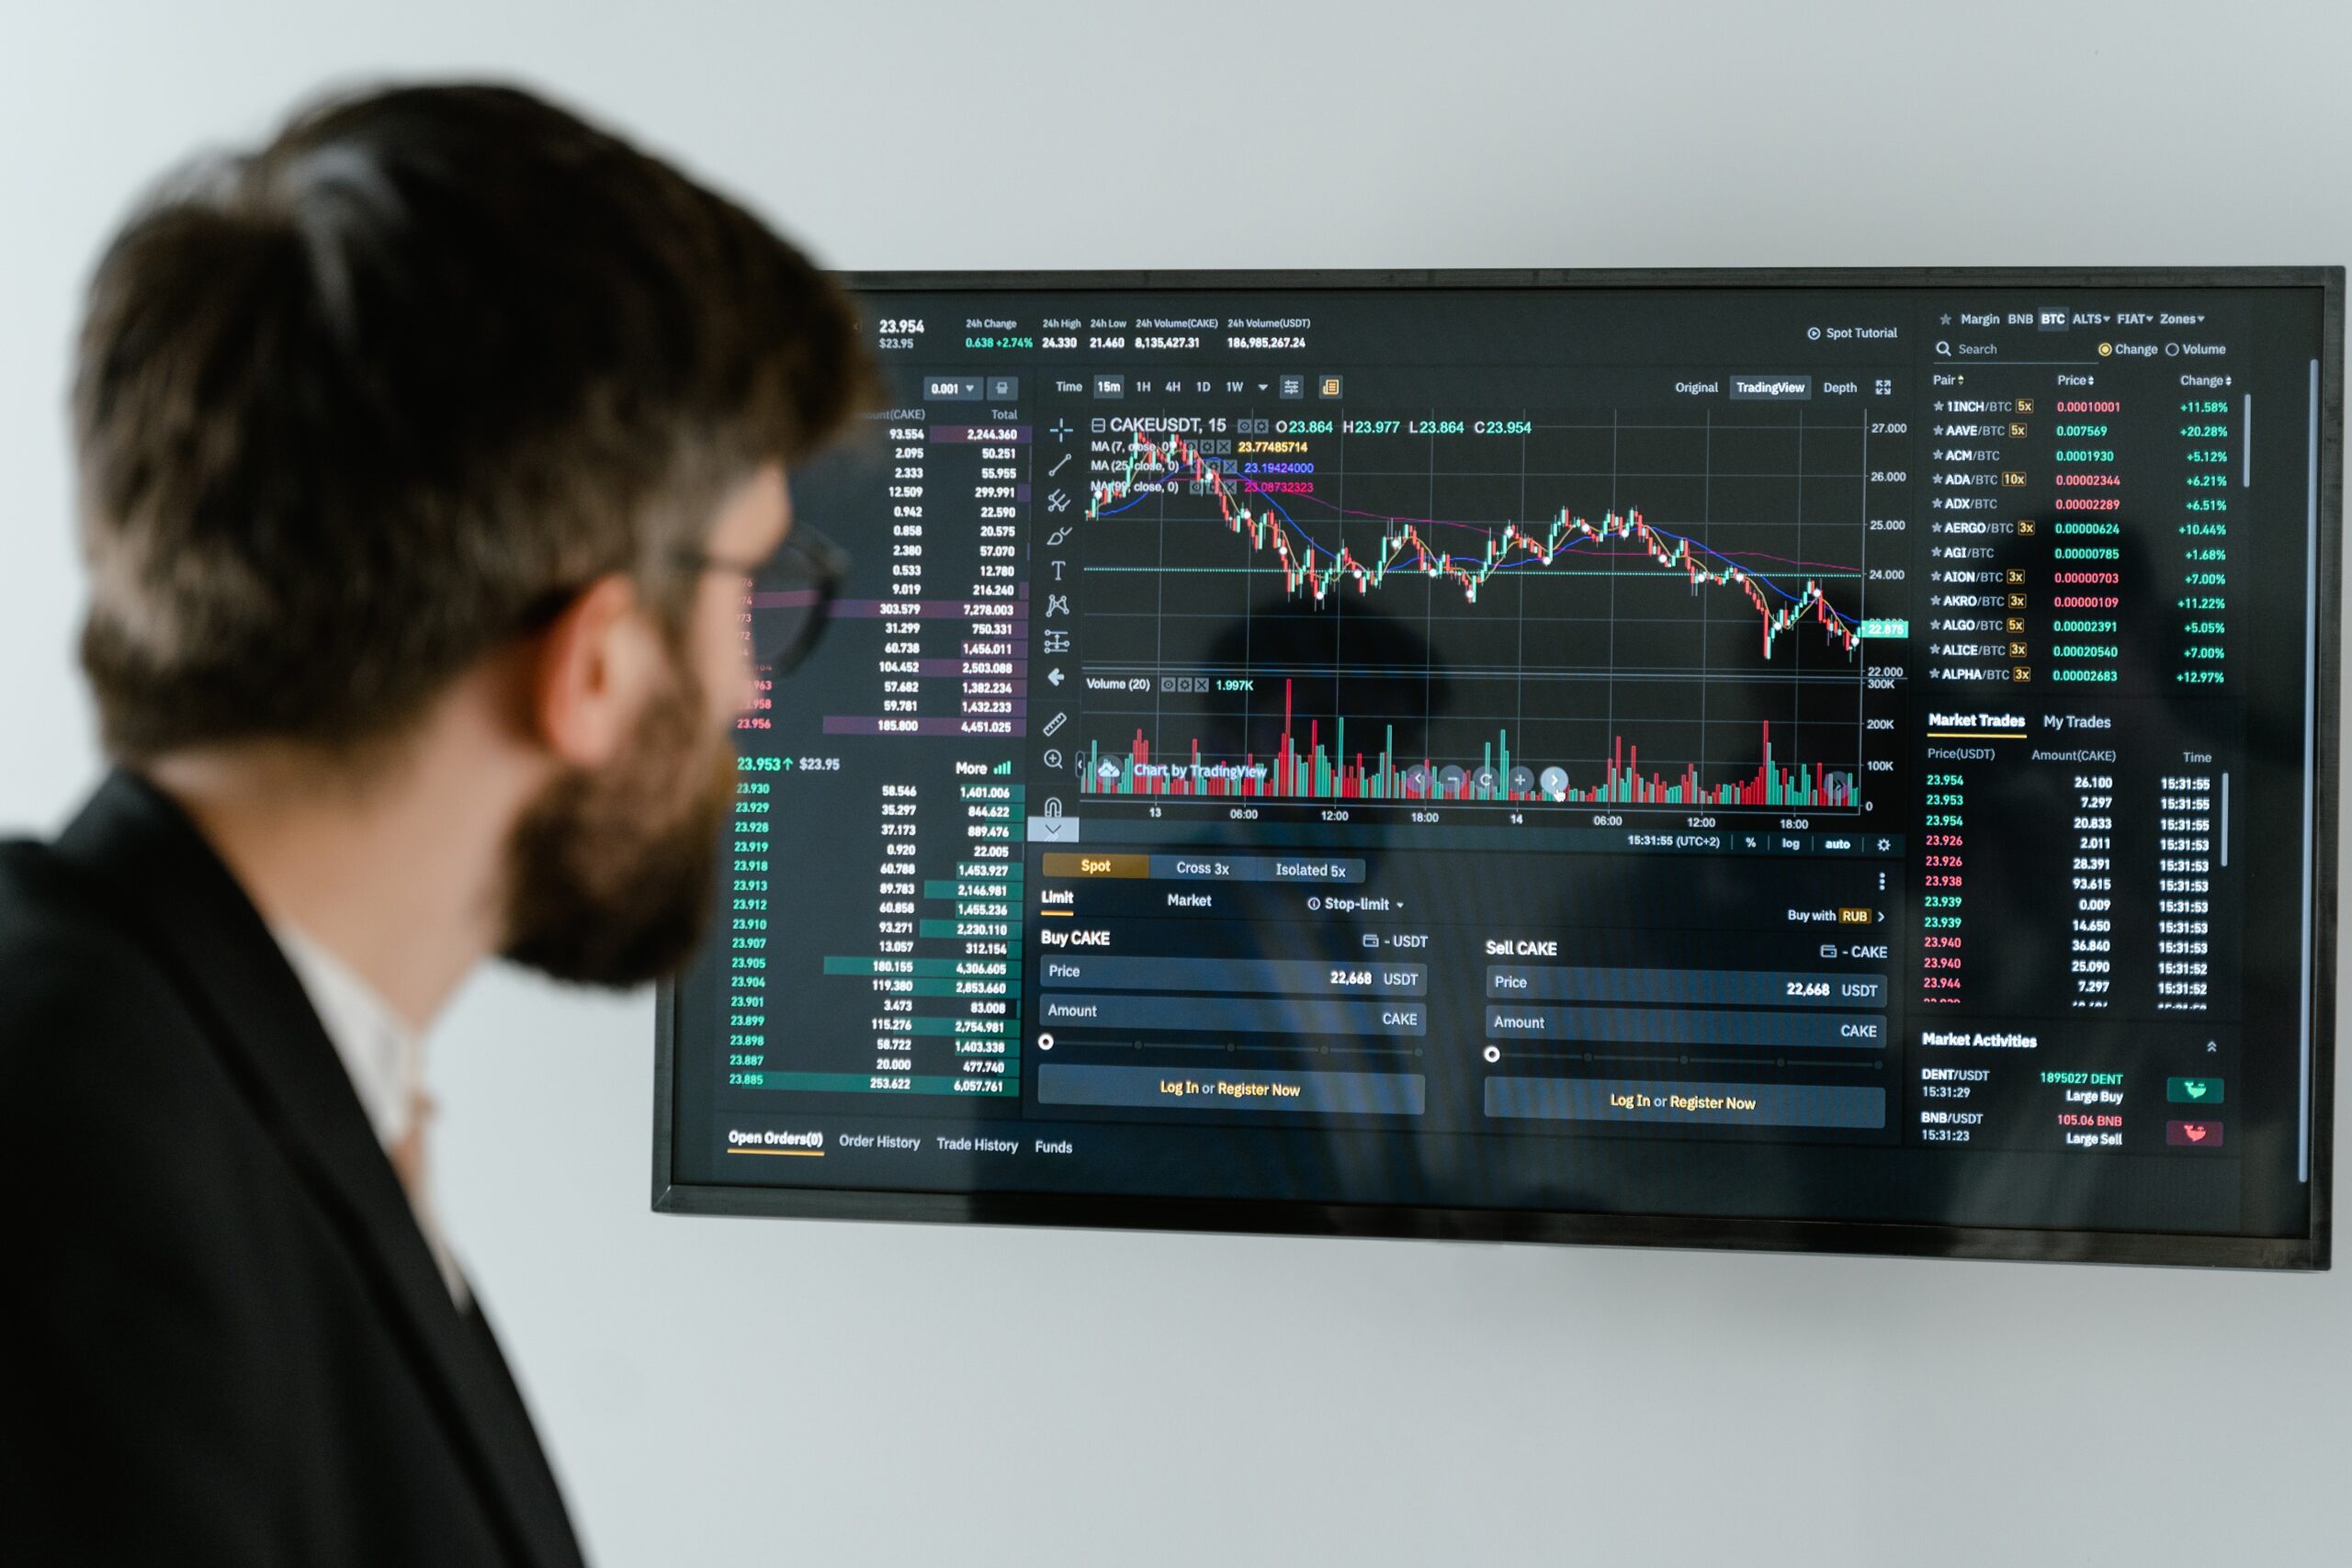
What Technical Indicators Should Beginners Use?
When trading cryptocurrencies, investors look to specialized indicators for guidance. These indicators have the potential to forecast the movement of an asset's price with a high degree of accuracy. Where can you find instructions on how to make the most of these tools?
Conceptual...

When trading cryptocurrencies, investors look to specialized indicators for guidance. These indicators have the potential to forecast the movement of an asset’s price with a high degree of accuracy. Where can you find instructions on how to make the most of these tools?
Conceptual Meaning of the Indicators
The price of digital assets can be predicted using a method called technical analysis, which is based on the history of price quotes. The proponents of this strategy claim that the chart showing the price of the currency already has all of the information that is necessary to understand how the value of the coin will fluctuate in the future. Indicators make up one of the tools used in technical analysis.
These are mathematical formulas that can assist in determining whether a growth or fall in the price of a cryptocurrency is likely to occur.
In most cases, users makes decision based on:
- Different levels of support and resistance These are the junctures from where a change in the overall trend is conceivable.
- Condition of having too much stock. If the price has increased at an excessively rapid rate, there is a chance that it will correct itself (the chart will return to the previous level).
- Activity carried out by additional users. An upward trend could be anticipated if the indications for cryptocurrency reveal that there has been an increase in the number of buyers.
To put it another way, the support level is a zone that, if reached, causes the price of an asset to begin climbing again from its lowest point. This level provides support for the value of the asset, keeping it from going lower than it currently is.
When the price of an asset reaches a resistance level, it causes the price to turn down from its previous high. The price can’t go any higher as long as there is resistance.
When working with support and resistance levels, it is essential to keep in mind that a price level is not a single, unambiguous round number, but rather a range of prices.
A categorization of indicators for use in performing technical analysis on the cryptocurrency market.
There are four distinct categories into which all algorithms can be placed:
- Trendy. They point in the primary direction of change in the quotations.
- Oscillators. They contribute to the search for moments of overbuying and overselling in the market. When conditions are like these, there is an increased likelihood of a reversal or a shift in the overall trend.
- According to the moving averages. Moving Average, commonly abbreviated as MA, has a presence on the internet as well.
- Volume. They focus on analyzing volatility, rather than the asset rate (the rate of price change).
It is possible to categorize all algorithms as either leading or lagging, with the distinction dependent on which event comes first: a change in the trend or a shift in the indicator. The Moving Average is a good illustration of a lagging indicator. It seems that MA will soon catch up with the chart.
Volume indicators
The price of digital currency is determined by the proportion of buyers to sellers at any given moment. If there are not many people buying and selling items on the market, the chart will not move. As soon as there is a greater interest from buyers or sellers, there is a rise in volatility. These acts are captured by volume indicators, which then provide a signal of an increase in demand or supply depending on the context.
Trendy
The level of volatility of cryptocurrencies can be determined using these metrics (growth or fall in quotes). The more frequently the rate shifts, the simpler it is to see the general trend. These items fall under this category:
- The levels of support and opposition (mainly Fibonacci).
- Ichimoku clouds.
- Momentum.
Oscillators
Forecast a change in the trend. These oscillators are included on the list of oscillators:
- Stochastic.
- MACD.
- R.S.I. stands for the Relative Strength Index (RSI).
Taking into account moving averages
The moving average is a mathematical function, and the value of the function is determined by the indications that came before it. There are indicators that are based on moving averages, such as:
- Simple MA.
- Exponential moving average.
- Bollinger Bands.
Since it is simple to ascertain the trend that is now present in the market by employing these instruments, the term “trend instruments” is commonly used to refer to them. The moving average also lags behind the movement of the quotes, which is another drawback.
Are These Indicators Useful?
Different values are placed on technical analysis by experienced traders and investors. There are others who believe that it is possible to develop a profitable trading strategy that utilizes multiple indicators. Others are certain that it will not be feasible to anticipate a change in patterns using this methodology.
Even an experienced user runs the risk of losing money. As a consequence of this, you cannot rely on the indicator for trading cryptocurrencies as a program that can reliably foresee the future. Other considerations, such as the news and the opinions of analysts, need to be taken into account.
