What Does VWAP Indicate?
Traders can use the VWAP indicator to figure out the average price at which a security was bought and sold during the day. We'll explain what the VWAP indicator is, how to use it in stock trading, and how to read it.
What is VWAP?
VWAP is an abbreviation for Volume Weighted...
Traders can use the VWAP indicator to figure out the average price at which a security was bought and sold during the day. We’ll explain what the VWAP indicator is, how to use it in stock trading, and how to read it.
What is VWAP?
VWAP is an abbreviation for Volume Weighted Average Price. The VWAP indicator is a type of technical analysis tool that shows the average price at which a security traded during the day. Traders use the VWAP indicator to compare how well an asset is doing to a “benchmark.” This gives them more information to help them decide whether to buy or sell an asset.
The VWAP indicator and how to use it
The VWAP indicator is a very useful tool for traders because it lets them see what happened during the trading day. Buying an asset at a price below the VWAP line is considered profitable, while buying above the indicator shows that you overpaid. Every day, the VWAP indicator is worked out by taking data from the start of trading until the end of trading.
In 1984, Abel Noser, the head trader at an analytical firm, was the first person to use VWAP. In the 1990s, traders found that the VWAP indicator strategy was a relatively safe way to trade. It wasn’t possible to win a lot of money with it, but it could help traders avoid bad losses.
How to determine VWAP value
To figure out the VWAP indicator, you need to look at the value of an asset in the first five minutes of trading, add the highest value, the lowest value, and the closing value, and then divide this number by three to get the average value. The VWAP indicator is the number you get when you divide this average by the number of assets that changed hands during that time. Then, this calculation has to be done over and over again throughout the day.
How to figure out what the VWAP means
If you look closely, you can see the VWAP indicator as a smooth blue line next to the jagged green price line.
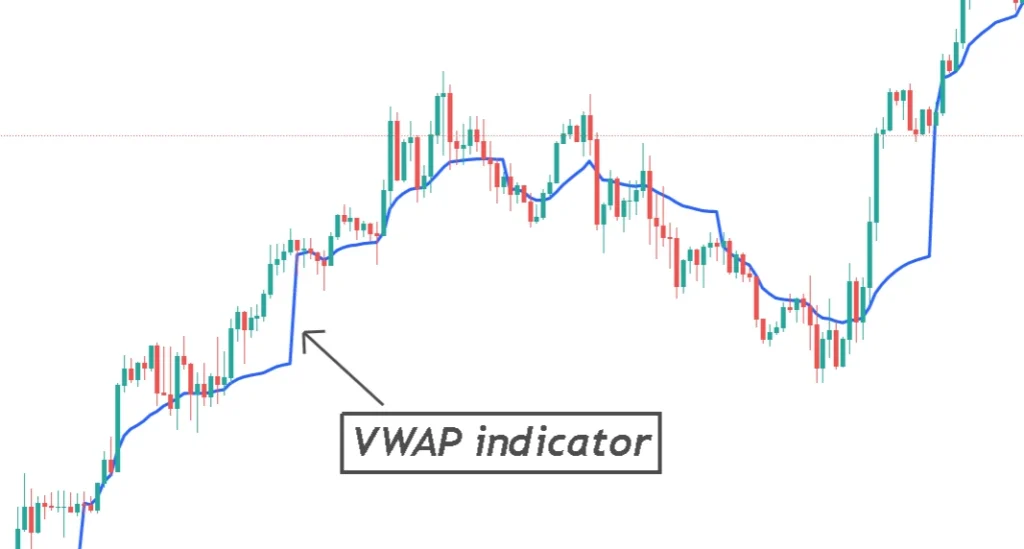
When the lines don’t match up, this is when trend patterns are made. In this chart, for example, the VWAP indicator is close to the price. This shows how, in theory, the VWAP indicator can be used to show how profitable an asset is.
Review of the VWAP Indicator: Main Problems
You can’t understand what the VWAP indicator is without knowing what its biggest problems are. Even though the VWAP indicator is useful for short-term and overnight trading, it is not perfect, especially when it comes to long-term work. If you try to figure out VWAP too many times over a few days, it can mess up the numbers and give you unreliable readings.
There are also questions about how useful it is during strong long-term trends. If the rally lasts for a long time, you might not see the price drop below the VWAP indicator and miss out on trading opportunities.
Lastly, the VWAP indicator only shows a small part of the price history of an asset. If you want to use the VWAP indicator as part of a trading strategy, you should think about using it with other analytical tools to get a more complete picture of how the market is doing.
Is there a profit guarantee with the VWAP indicator?
Always keep in mind that you need to do your own research and that the price of a stock, product, or cryptocurrency can go up and down. Never put in more money than you can afford to lose.